Concepts
Understanding velocity
Velocity compares, sprint after sprint, the points the team committed at start and the points it delivered at closing. It helps you size the next sprint.
In your project, Reports in the sidebar opens the Team velocity screen. Any project member can view it, Viewers included. Velocity tells you how many points the team usually delivers in a sprint. It is the basis for deciding how much to commit to in the next one.
Committed and delivered
Link to the “Committed and delivered” sectionEach closed sprint carries two figures, and neither of them changes afterwards.
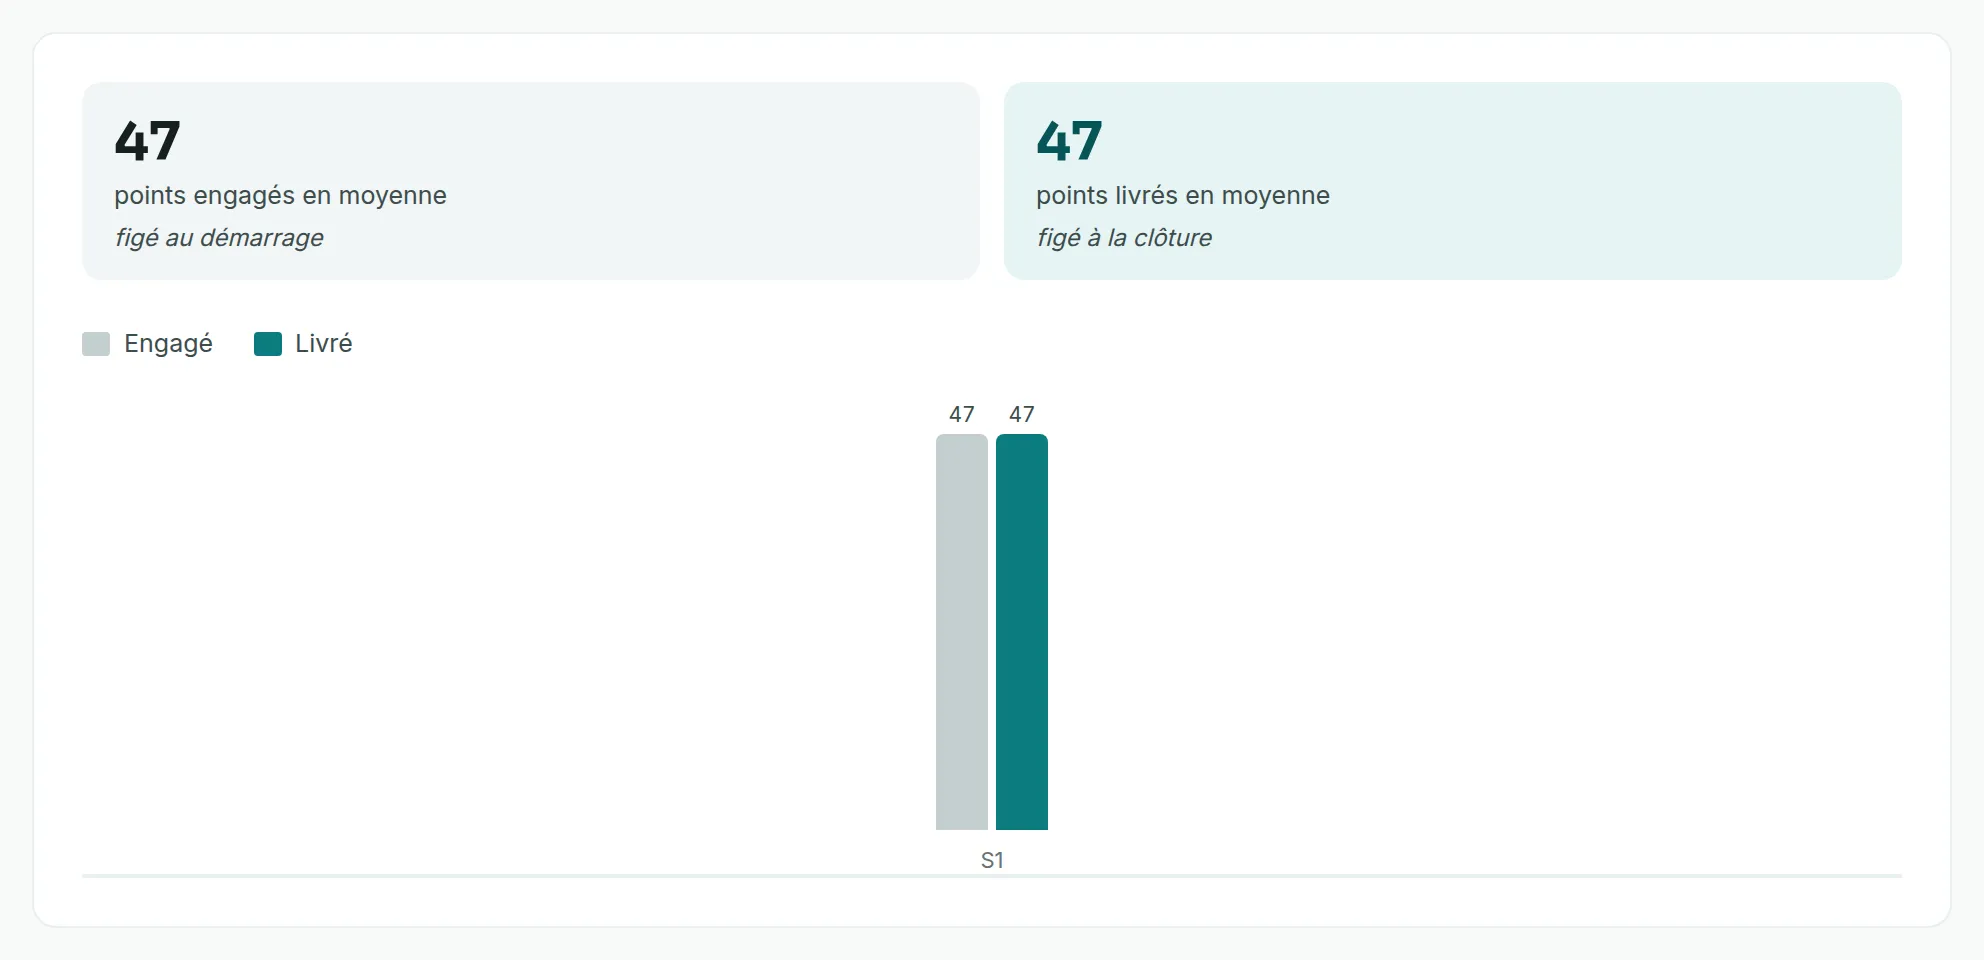
- Committed is the sum of the points of the tickets that were in the sprint when it started. It is frozen at start.
- Delivered is the sum of the points of the tickets done at the time of closing. A ticket is done when its status belongs to the Done category. This figure is frozen at closing.
So re-estimating, reopening or moving a ticket later does not change the velocity of a closed sprint. An unestimated ticket counts as zero points. Delivered can exceed committed, when tickets were added during the sprint.
The sprints taken into account
Link to the “The sprints taken into account” sectionOnly closed sprints go into velocity. A running sprint has nothing delivered yet, and counting it as zero would wrongly lower the average.
The screen takes the project’s last seven closed sprints, ordered by closing date and not by number. A sentence above the figures says which sprints they cover, for example “The last 7 closed sprints, from Mar 3 to Jun 23.” When the project has closed fewer than seven sprints, it says so, for example “This project has closed only 3 sprints, from May 12 to Jun 23. The window asked for 7: the average rests on those alone.”
The two averages
Link to the “The two averages” sectionTwo tiles give the points committed on average and the points delivered on average, rounded to one decimal place. They cover the same sprints as the histogram. A team that delivers clearly less than it commits to, sprint after sprint, should commit to less at the next start.
The histogram
Link to the “The histogram” sectionEach closed sprint has two bars side by side, Committed and Delivered, with their value above them. The oldest sprint is on the left. Under each pair, a short label gives the sprint number, such as S7 for sprint 7. A table gives the same figures to screen readers, with the closing date of each sprint.
When the screen is empty
Link to the “When the screen is empty” sectionAs long as no sprint has been closed, the screen says so: “No sprint has been closed on this project yet: there is nothing to average. The first bar will appear at the first closing.” The Open the backlog link leads to where sprints are created and closed. See Close a sprint.
The other reports
Link to the “The other reports” sectionAt the top of the screen, Burndown of the current sprint opens the chart of the running sprint, if there is one. Each closed sprint is also listed there, with Sprint report and Burndown. See Understanding a sprint burndown and Understanding the sprint report.
Good to know
Link to the “Good to know” section- If velocity does not load, the screen shows “Velocity could not be loaded.” followed by the cause, with Retry.
- The seven-sprint window cannot be changed from the screen.