Concepts
Understanding a sprint burndown
The burndown shows, day after day, what was left to do in a sprint, against an ideal line that goes down to zero. You can read it during the sprint and after it is closed.
A sprint’s burndown opens from the backlog, with View the burndown in the sprint header, whatever its state. It also opens from Reports, in the project sidebar, with Burndown of the current sprint when a sprint is running, and Burndown next to each closed sprint. Any project member can view it, Viewers included.
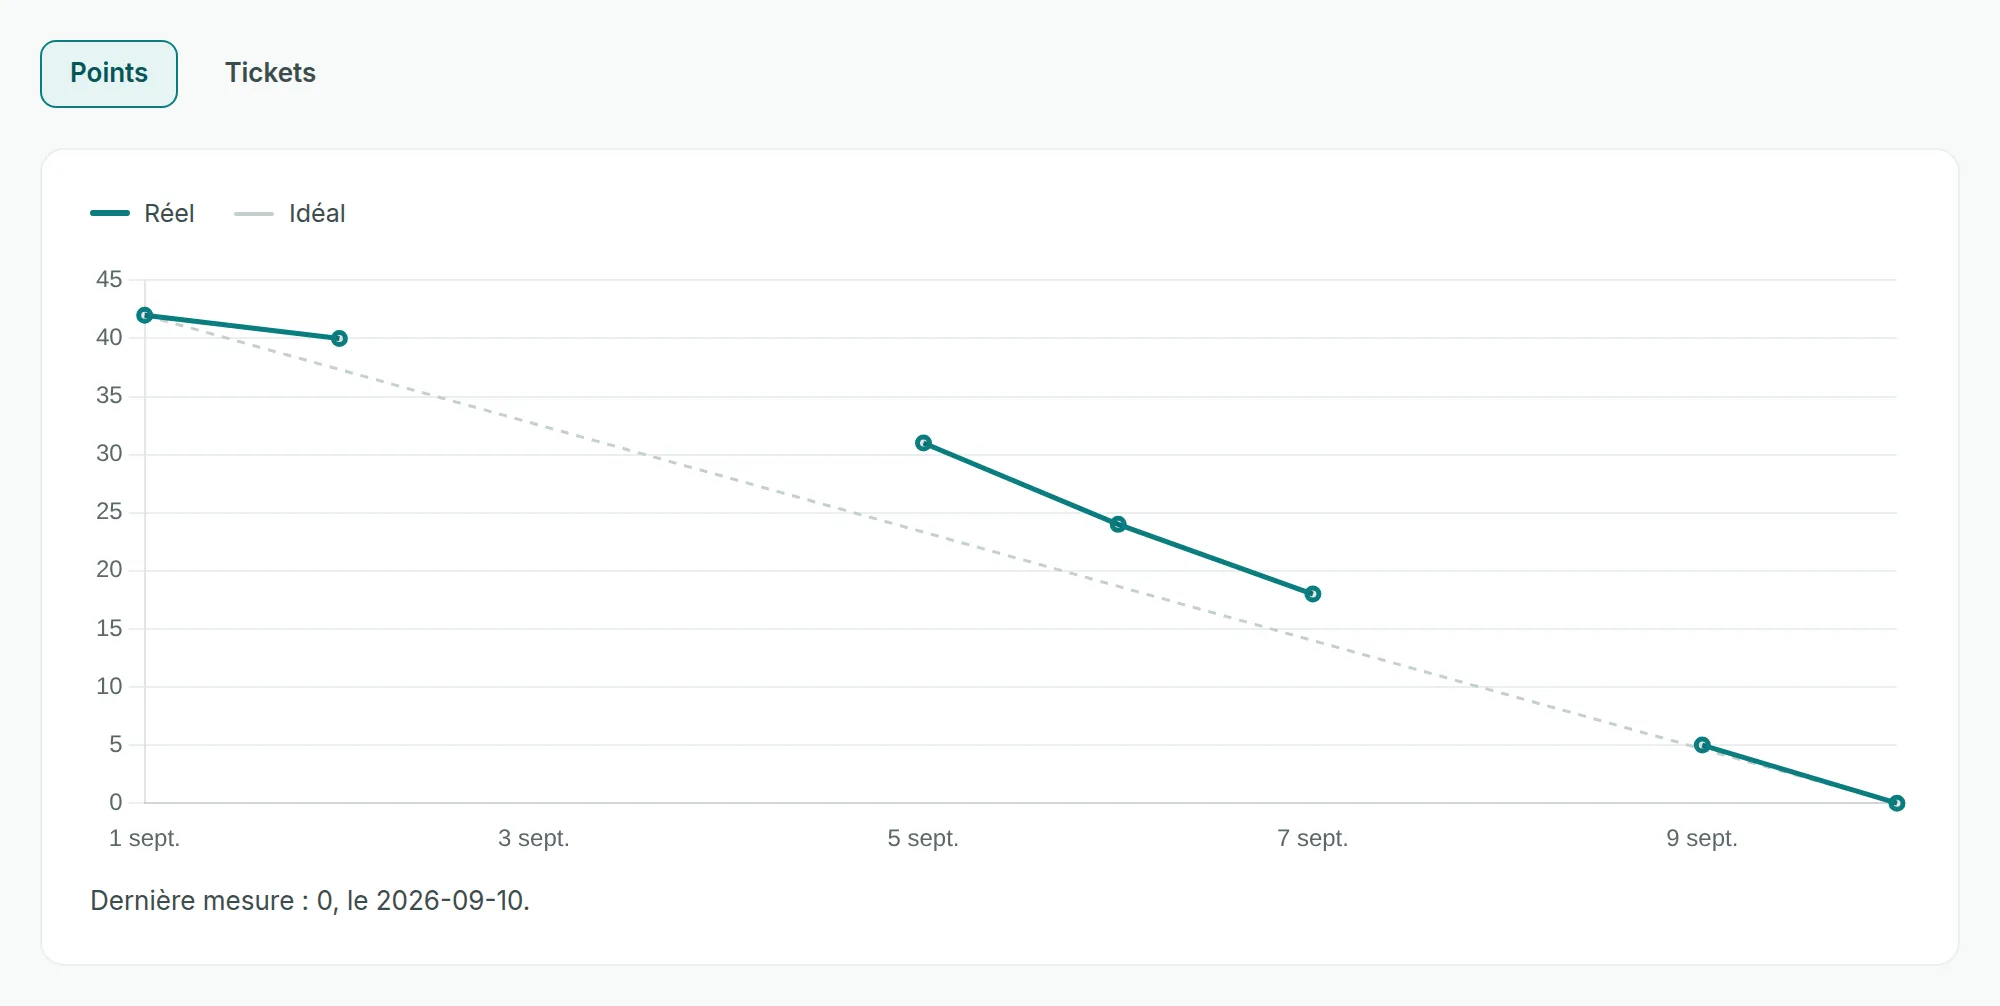
What the curve shows
Link to the “What the curve shows” sectionThe Actual curve has one point per day. Each point says what was left to do in the sprint that day, that is, the tickets whose status is not in the Done category.
The toggle at the top of the screen chooses the unit. In Points, the curve adds up the estimates of the remaining tickets. In Tickets, it counts these tickets. An unestimated ticket weighs zero points, but it counts as one ticket. So a team that does not estimate its tickets reads its progress in Tickets.
Under the chart, a sentence gives the last measured value and its day, for example “Last measure: 5, on 2026-09-09.”
One record a day, which never changes
Link to the “One record a day, which never changes” sectionThe product records once a day what is left to do in each running sprint. A day’s record is taken on the first run of that day, in UTC time, then it no longer moves. So work finished during the day shows on the next day’s point.
A record is never recalculated. Finishing a ticket today does not change yesterday’s value, and the past curve does not improve afterwards. Adding a ticket during the sprint makes the curve go back up, and the burndown shows it as it is.
The ideal line
Link to the “The ideal line” sectionThe dotted Ideal line is a guide. It starts from the value of the first measured day and goes down in a straight line to zero on the last day of the curve. During the sprint, that last day is the day of the last record, not the planned end date. On a closed sprint, it is the last day recorded before closing.
Days without a measure
Link to the “Days without a measure” sectionIf a record could not be taken on a given day, that day stays empty. The curve breaks, and the table of values shows “not measured”. The product never fills a gap, neither with an average of the neighbouring days nor with the previous day’s value. Missed days are marked as gaps at the next record.
The “What was left, day by day” table gives the same values to screen readers, gaps included.
During the sprint and after
Link to the “During the sprint and after” sectionWhile the sprint is in progress, the curve grows by one point a day, even after its planned end date, until closing. Once the sprint is closed, records stop and you can still view the curve, as it was at closing.
A planned sprint, or one started only recently, has no record yet. The screen then shows “No day has been recorded for this sprint yet.” The first point appears at the first record after the start.
Good to know
Link to the “Good to know” section- If the curve does not load, the screen shows “The sprint’s burndown could not be loaded.” followed by the cause, with Retry.
- “This sprint does not exist, or you are not a member of the project.” means that the address leads to no sprint, or that you are not a member of its project.
- To compare sprints with each other, see Understanding velocity.